Month: January 2018

Nifty looks shaky ahead of Budget; here are 3 stocks which can give up to 26% return

Posted on

The immediate resistance on the upside is placed in the range of 11,200-11,250, and a sustained trade above 11,250 can take it to levels of 11,390.

Moneycontrol News@moneycontrolcom

By Aditya Agarwala

The Nifty50 Index continued to ascend following an extended weekend adding a total of 5 percent in the month of January so far. Further, the ongoing impulse wave 3 can extend up to 11,390 being 161.8% extension of the wave 1 (i.e. 6833-8995).

The immediate resistance on the upside is placed in the range of 11,200-11,250, and a sustained trade above 11,250 can take it to levels of 11,390.

Moreover, the relative strength index (RSI) has started forming a negative divergence on the daily chart suggesting that the uptrend is maturing gradually.

Failure to cross 11,250 can lead to minor profit booking dragging the Index lower to levels of 10,810-10,725 being 50% & 61.8% Fibonacci retracement levels respectively.

The Bank Nifty is also approaching upper end of a rising channel placed at 27900, following a massive gain of 7 percent in the month so far.

Failure to cross this resistance can lead to profit booking dragging it lower to levels of 26,840-26,595. However, a sustained trade above 27,900 can extend the up move to levels of 28,990.

Here is a list of three stocks which can give up to 26% return in the next 3-4 weeks:

1

Take Solutions Ltd: BUY| Target Rs200| Stop Loss Rs149| Return 18%

On the weekly chart, Take Solutions Ltd. (TAKE) is on the verge of a breakout from an Ascending Triangle pattern suggesting the start of a bull trend on the cards. A sustained trade above Rs 180 i.e. neckline of the pattern with healthy volumes may trigger a bullish breakout.

On the daily chart, the stock is consolidating sideways after taking support at 61.8% Fibonacci retracement level. A sustained trade above Rs 178 will trigger a bullish breakout.

RSI has formed a positive divergence with respect to price after taking support at the 40 level. The stock may be bought in the range of Rs 166-170 for the target of Rs 190-200, and keeping a stop loss below Rs 149.

Mangalam Cement Ltd: BUY| Target Rs490| Stop Loss Rs375| Return 19%

On the weekly chart, Mangalam Cement Ltd. is in a throwback mode following its breakout from a Triangle pattern. Neckline support of the pattern is at Rs 390; sustained trade above the neckline with healthy volumes can resume the uptrend.

On the daily chart, the stock is approaching 61.8% Fibonacci retracement support level placed at Rs 396. A sustained trade above this support can take the stock higher.

RSI has turned upwards breaking out of the upper band of the Bollinger Bands suggesting higher levels in the coming trading sessions. The stock may be bought in the range of Rs 405-415 for targets of Rs 460-490, keeping a stop loss below Rs 375.

J. Kumar Infraprojects Ltd: BUY| Target Rs400| Stop Loss Rs288| Return 26%

On the weekly chart, J. Kumar Infraprojects Ltd is in a throwback mode to test the trend line support placed at Rs 280 levels. A sustained trade above Rs 280 can resume the uptrend taking the stock higher.

On the daily chart, it has taken support at the lower end of the channel and turned upwards affirming the bullishness.

Further, RSI has also broken down from the lower Bollinger band suggesting lower levels. The stock may be sold in the range of Rs 310-320 for targets of Rs 365-400, keeping a stop loss below Rs 288.

Disclaimer: The author is Technical Analyst, YES Securities (I) Ltd. The views and investment tips expressed by investment expert on Moneycontrol.com are his own and not that of the website or its management. Moneycontrol.com advises users to check with certified experts before taking any investment decisions.

Bull’s Eye: Buy Hexaware, Jet Airways, Prism Cement; sell Voltas, Godrej Industries

Posted on

Gaurav Ratnaparkhi of Sharekhan is of the view that one may buy Jet Airways with a target of Rs 795.

Bull’s Eye, CNBC-TV18’s popular game show, where market experts come together to dish out trading strategies for you to make your week more exciting and compete with each other to see whose portfolio is the strongest.

Remember these are midcap ideas not just for the day, but stocks that look attractive in the medium-term as well.

This week, Gaurav Ratnaparkhi, Shahina Mukadam and Vishal Malkan battle it out for top honours.

Below their top stock picks and analysis:

Gaurav Ratnaparkhi of Sharekhan

Buy MRPL with a stoploss at Rs 126 and target of Rs 134.50

Buy Jet Airways with a stoploss at Rs 744 and target of Rs 795

Sell IDFC Bank Future with a stoploss at Rs 58.80 and target of Rs 55

Sell Voltas Future with a stoploss at Rs 624 and target of Rs 585

Shahina Mukadam, Independent Market Expert

Buy Hindustan Zinc with a stoploss at Rs 298 and target of Rs 330

Buy Prism Cement with a stoploss at Rs 128 and target of Rs 147

Sell Godrej Industries with a stoploss at Rs 625 and target of Rs 590

Sell L&T Finance Holdings with a stoploss at Rs 180 and target of Rs 168

Vishal Malkan of malkansview.com

Buy Mphasis with a stoploss at Rs 870 and target of Rs 970

Buy Polaris with a stoploss at Rs 395 and target of Rs 445

Buy Hexaware with a stoploss at Rs 372 and target of Rs 420

Trade setup for Wednesday: Top 15 things you should know before Opening Bell

Posted on

Investors should tread with caution in the run-up to the budget and maintain a strict stop loss below 10896.

Indian market saw profit booking after rising for 5 out of 6 trading sessions ahead of the big event, ‘Budget 2018’. The index formed a Bearish Belt Hold kind of pattern on the daily candlestick charts which suggest caution for traders.

The index formed a Bearish Belt Hold kind of pattern after a small bullish candle which suggests that the momentum is slowing down. Investors should tread with caution in the run-up to the budget and maintain a strict stop loss below 10896.

A ‘Bearish Belt Hold’ pattern is formed when the opening price becomes the highest point of the trading day (intraday high) and the index declines throughout the trading day making up for the large body. The candle will either have a small or no upper shadow and small lower shadow.

In Tuesday’s price action, Nifty50 opened at 11,120.85 and rose marginally to 11,121.10. The bears took control of D-Street in morning trade and pushed the index below its 5-days exponential moving average (DEMA). The Nifty slipped to an intraday low of 11,033 before it closing 80 points lower at 11,049.65.

“The Nifty formed a Bearish Belt Hold candle on the daily chart and closed the session with the loss of around 80 points. It wiped out the gains of last three sessions but still holding above psychological 11,000-mark,” Chandan Taparia, Derivatives, and Technical Analyst at Motilal Oswal Securities told Moneycontrol.

“Now, Nifty has to cross and hold above 11111 zones to extend its move towards 11170 then 11250 levels while on the downside support exists at 10990 then 10888 levels,” he said.

India VIX fell down by 8.24 percent at 16.41. The sudden decline in VIX has hurt the option premium ahead of Union Budget. However, if VIX cools down then it would be a positive sign for the market to hold the lower supports, suggest experts.

We have collated the top fifteen data points to help you spot profitable trade:

Key Support & Resistance Level for Nifty:

The Nifty closed at 11,049.7 on Tuesday. According to Pivot charts, the key support level is placed at 11,015.37, followed by 10,981.03. If the index starts to move higher, key resistance levels to watch out are 11,102.57 and 11,155.43.

Nifty Bank:

The Nifty Bank closed at 27,269.1. Important Pivot level, which will act as crucial support for the index, is placed at 27,184.07, followed by 27,099.03. On the upside, key resistance levels are placed at 27,412.17, followed by 27,555.23.

Call Options Data:

Maximum call open interest (OI) of 29.68 lakh contracts stands at strike price 11,500, which will be a crucial base for the January series, followed by 11,000, which now holds 27.99 lakh contracts in open interest, and 11,200, which has accumulated 24.06 lakh contracts in OI.

Call writing was seen at the strike price of 11,500, which saw the addition of 4.98 lakh contracts along with 11,300, which added 4.62 lakh contracts, along with 11,100, which saw the addition of 3.21 lakh contracts.

Call unwinding was seen at strike price of 10,800, which shed 1.01 lakh contracts, followed by 10,500, which shed 0.65 lakh contracts.

Image1

Put Options Data:

Maximum put OI of 54.01 lakh contracts was seen at strike price 10,500, which will act as a crucial base for January series, followed by 11,000, which now holds 37.6 lakh contracts and 10,700 which has now accumulated 34.46 lakh contracts in open interest.

Maximum Put writing was seen at the strike price of 10,700, which saw the addition of 7.09 lakh contracts, followed by 11,000, which added 3.6 lakh contracts and 10,500, which added 2.55 lakh contracts.

Put unwinding seen the most at strike price of 10,800, which shed 2.08 lakh contracts.

Image2

FII & DII Data:

Foreign institutional investors (FIIs) sold shares worth Rs 105.56 crore, while domestic institutional investors (DIIs) sold shares worth Rs 281.65 crore in the Indian equity market, as per provisional data available on the NSE.

Fund Flow Picture:

fundflowjan30

Stocks with high delivery percentage:

High delivery percentage suggests that investors are accepting the delivery of the stock, which means that investors are bullish on the stock.

Image4

37 stocks saw long build-up:

Image5

28 stocks saw short covering:

A decrease in open interest along with an increase in price mostly indicates short covering.

Image6

119 stocks saw short build-up:

An increase in open interest along with a decrease in price mostly indicates short positions being built up.

Image7

27 stocks saw long unwinding:

Long unwinding happens when there is a decrease in OI as well as in price.

Image8

Bulk Deals:

Bhushan Steel: EARC Trust SC 283 sold 1,253,459 shares at Rs 51.51 per share

Himatsingka Seide: Anuradha Himatsingka bought 746,000 shares at Rs 355 per share

KPIT Cummins Infosystems: Alphagrep Commodities Private Limited bought 11,51,890 shares at Rs 215.86 per share

Religare Enterprises: Minesh Jormalbhai Mehta sold 10,00,000 shares at Rs 45.17 per share

(For more bulk deals click here: https://goo.gl/qrXHCH)

Analyst or Board Meet/Briefings:

Aditya Birla Fashion and Retail: The company will be hosting analysts’ call on February 2, 2018.

The management of Arvind Limited will hold a conference call to discuss financial results on January 31, 2018.

Stocks in news:

Mahindra & Mahindra: The company has purchased 26% of the Share Capital of M.I.T.R.A. Agro Equipments Private Limited.

Deepak Nitrite raised around Rs 149 crore from qualified institutional placement.Videocon Industries: To Challenge NCLT Proceedings Against Itself

MCX: SEBI disposes off cases against founders without penalty

InterGlobe: Former Jet Airways CEO Wolfgang Prock-Schauer To Join IndiGo As COO

Idea Cellular: Gets shareholders’ nod for issue of shares via QIP.

2 stocks under ban period on NSE

Security in ban period for the next trade date under the F&O segment include companies in which the security has crossed 95 percent of the market-wide position limit.

The security which are banned for trading are JP Associates and Wockhardt.

Immediate support seen at 11,000; 5 stocks which can give up to 10% return

Posted on

Immediate support for the index is seen at 11,000-10,970 levels, holding above these levels index is likely to rally towards 11,360-11,400 levels on the upside.

Moneycontrol News@moneycontrolcom

Ashish ChaturmohtaSanctum Wealth ManagementAfter a long weekend, the market saw a positive start to the week with Nifty50 closing at yet another record high of 11,130 levels with 0.55 percent gain on Monday.

Last week, index gave a breakout above the psychological level of 11,000 with a gap and since then managed to sustain above it, indicating strong bullish bias.

But, the broader market has been trading in contrast to Nifty with Mid and Small cap space seeing a good correction. Thus, the rally has been stock specific and confined to frontline stocks.

Immediate support for the index is seen at 11,000-10,970 levels, holding above these levels index is likely to rally towards 11,360-11,400 levels on the upside.

In Put, Nifty options 10,800 to 11,000 strikes witnessed open interest (IO) addition suggesting base moving higher for the market while maximum OI stood at 10,500.

The Nifty option Put/Call ratio (PCR) of open interest (IO) has seen cooling off from an extreme high of 1.89 post-January expiry to 1.44 levels currently.

India VIX has moved up from 14 levels to 17.89 levels in anticipation of Budget this week as the market may see volatility later in the week.

Here is a list of top 5 stocks which could give up to 10% return in the short term:

Bajaj Auto Ltd: CMP 3364| Stop loss 3290| Target 3650| Return 9%

The stock is in a long-term uptrend forming the higher top and higher bottom formation. For the last three months, the stock has been consolidating broadly in a range of 3380 and 3140 levels.

This consolidation has been above the previous pivotal high of 3120 indicating buying coming in at higher levels. The MACD on the daily charts has moved above neutral level of zero and the stock is likely to see a breakout on the upside.

Thus, the stock can be bought at current levels and on dips to 3335 with a stop loss below 3290 for a target of 3650 levels.

Zee Entertainment Ltd: BUY| CMP 609| Stop loss 593| Target 660| Return 8%

The stock hit a high of 590 in October 2016 and since then it has been trading below it to form a base for the next leg of the rally. A couple of weeks back, the stock witnessed a breakout above this pivotal high of 590 with high volumes indicating buying participation in the stock.

Since then, the stock has been consolidating above breakout level of 590 and sustaining above it. Relative strength index or RSI and Stochastic indicators have given a positive crossover with their respective averages suggesting a change in momentum and the stock is likely to see a breakout on the upside after recent consolidation.

The stock can be bought at current levels and on dips to 600 for a target of 658 levels which is the previous all-time high for the stock. Price has been taking support at 20-days moving average (DMA) which comes at 593 levels, and a stop loss can be placed below this average on a closing basis for long positions.

Tata Steel Ltd: BUY| CMP 783| Stop loss 760| Target 840| Return 7%

The stock is in a strong long-term uptrend forming a higher top and higher bottom formation. The rally had stalled in the month of November and December after hitting high of 735 as it faced resistance at a multi year high of 739 levels.

Post two-month consolidation price gave a breakout above 739 in early January to hit a high of 793. Post breakout, the price is sustaining above the previous highs and the volumes have also seen decline indicating market participants holding on their long positions in the stock.

In the last few trading sessions, positive price action has been witnessed accompanied by volumes suggesting the stock is likely to see resume its uptrend after short-term consolidation.

Thus, the stock can be bought at current levels and on dips to 775 with a stop loss below 760 for target 840 levels.

Mahindra & Mahindra Ltd: BUY| CMP 764| Stop loss 740| Target 840| Return 10%

Looking at the long-term chart, the stock has seen multiyear consolidation between 750 and 545 levels since August 2014.

Recently, the stock gave breakout from this consolidation with high volumes indicating strong buying participation in the stock.

Since then volumes have been below average as the stock went into a consolidation zone. The stock is currently witnessing consolidation at all-time highs and above its breakout levels suggesting a breakout is likely to sustain.

Thus, the stock can be bought at current levels and on dips to 755 with a stop loss of 740 for a target 900 levels.

IndusInd Bank Ltd: BUY| CMP 1743| Stop loss 1700| Target 1850| Return 6%

The stock is in a long-term uptrend forming a higher top and higher bottom formation. The stock hit a high of 1804 in last September and then corrected down to 1572 levels.

It has seen consolidation at lower levels and this month stock has started to see upward movement. Thus, leading to saucer bottom formation in the stock.

MACD on the weekly chart has given positive crossover with its average indicating correction is over and the stock is resuming its uptrend. Thus, the stock is a buy at current levels and on dips to 1725 with a stop loss of 1700 for target 1850 levels.

Disclaimer: The author is Head of Technicals and Derivatives, Sanctum Wealth Management. The views and investment tips expressed by investment expert on Moneycontrol.com are his own and not that of the website or its management. Moneycontrol.com advises users to check with certified experts before taking any investment decisions.

Sensex @record highs! 10 stocks to buy in Budget week which could give up to 24% return

Posted on

The market looks little nervous ahead of budget especially on long term capital gains (LTCG) front and fiscal consolidation roadmap which could fuel some profit taking either ahead of post Budget session.

After a historic week, Indian market saw a blockbuster opening on Monday which took the Nifty50 to record high of 11,148.25 in morning trade. Tracking the momentum, the Nifty Bank and the S&P BSE Sensex rose to a fresh record high of 27,635.65 and 36,356.99 respectively.

Indian market closed the week on a high note, up 1.6 percent for the week ended January 25, ahead of the crucial Budget week which most experts think could belong to the bulls again.

The index is likely to clock fresh highs in the Budget week fuelled by further short coverings as well as strong global cues. Investors are advised to remain long on the index with a strict trailing stoploss around 11,000 which is a key support for the index.

However, in the budget week, analysts advise investors to remain stock specific and focus less on the index which is likely to remain volatile. One should look to buy the stocks from the sectors which have shown a lot of expectation buildup for the forthcoming budget.

“Sectors which are bullish on their long-term charts and have witnessed outperformance viz., sectors like cement, infrastructure, FMCG, and automobiles are likely to exhibit bullishness ahead of budget as the near/short term charts are sustaining above breakout levels could be in action ahead of the Budget,” Rajesh Palviya, Head – Technical & Derivatives Analyst, Axis Securities told Moneycontrol.

The market looks little nervous ahead of budget especially on long term capital gains (LTCG) front and fiscal consolidation roadmap which could fuel some profit taking either ahead of post Budget session.

“Most of the midcap stocks have witnessed profit booking and midcap index has corrected significantly ahead of budget. We feel the index is likely to hold the ground on the higher side till budget unfolds and Nifty is likely to scale up towards 11,200-11,300 in the pre-budget rally,” said Palviya.

The Nifty successfully managed to defend its important milestone of 11,000 on a weekly basis. Abundant liquidity and strong global cues supported the sentiment on the Street.

Of late, we saw tremendous optimism in our market and hence, the index kept marching higher to conquer many important junctions. “However, since the last couple of days, we can see some respite in the market as the index hastened towards its crucial near-term point of 11,100 before anyone could realise it,” Sameet Chavan, Chief Analyst, Technicals & Derivatives at Angel Broking told Moneycontrol.

“Traders should look to take some money off the table ahead of the major event (Budget). Last year, trading before the budget was quite easy as compared to the current one; but now, low hanging fruit is already gone and hence, it would be a daunting task finding good trade setups,” he said.

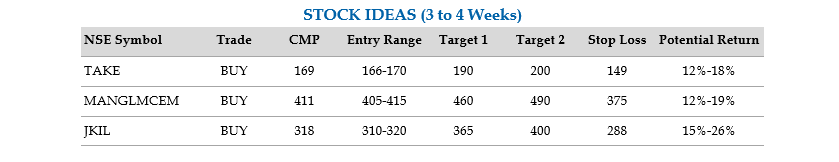
Here is a list of ten trading ideas based on technical parameters to buy ahead of the Budget which could give up to 24 percent return in the short term:

Analyst: Mazhar Mohammad, Chief Strategist – Technical Research & Trading Advisory, Chartviewindia.in

Sun Pharma: BUY| Target Rs650| Stop Loss Rs567| Return 12%

This counter appears to be on the verge of a breakout above its three old downward sloping channel. A sustainable close above 600 can signal the end of its prolonged downtrend which can kick in a medium-term uptrend in this counter.

Hence, in anticipation of such a breakout, traders should go long for the initial targets placed at Rs650 with a stop below Rs567 on closing basis.

Tata Elxsi: BUY| Target Rs1190| Stop Loss Rs1000| Return 9.4%

This counter registered a breakout above its three-month-old ascending channel which should accelerate its upmove further towards its lifetime highs of Rs1200.

Considering the volatile nature of this counter, traders should adopt a two-pronged strategy of buying now and on declines around Rs1030 if available at those levels. A stop for the trade should be placed below Rs1000 on a closing basis for an initial target of Rs1,190.

Reliance Industries: BUY| Target Rs1020| Stop Loss Rs934| Return 6%

This counter appears to be in a multi-week corrective and consolidation phase after hitting a lifetime high of Rs957 in last October.

Hence, a current breakout above this high couple of days back with a gap up is encountered with selling pressure. However, as strong support is placed in the zone of Rs940-934, one should make use of the current weakness and go long as it will sooner than latter registers a sustainable breakout above 960 with a target of 1020. A stop for the trade should be a close below 934.

Disclaimer: Reliance Industries Ltd. is the sole beneficiary of Independent Media Trust which controls Network18 Media & Investments Ltd.

Analyst: Sameet Chavan, Chief Analyst, Technicals & Derivatives at Angel Broking

Majesco: BUY| Target Rs702| Stop Loss Rs481| Return 24%

The stock has been maintaining its sturdy structure ever since we witnessed a trend reversal around 400 in the month of September 2017.

Recently, there was a breakout seen from the congestion zone around Rs560 along with significantly higher volumes. This development confirmed a ‘Bullish Flag’ pattern on the weekly chart and thereby projecting much higher levels in months to come.

Thus, we recommend buying this stock for a target of Rs.702. The stop loss should be fixed at Rs. 481.

ITC: BUY| Target Rs304| Stop Loss Rs258| Return 8%

After taking a strong knock during the midst of the July month, this stock slipped into a consolidation mode and has contributed nothing in the gigantic rally our markets experienced meanwhile.

Now, looking at past couple of weeks’ price action, it appears that the stock is out of its ‘Sleep Mode’ and poised for a decent up move.

The strong base building process has already been done around 250 – 260 and unless we don’t see any unfavorable outcome from the budget (excised duty on cigarettes), this stock is likely to do well in coming weeks.

Considering it’s over sensitiveness to this announcement, traders are advised to follow strict stop loss at Rs.258 for any long positions. One can look to buy around Rs.275 for a target of Rs.304.

Analyst: Aditya Agarwal, Head Technical Research, Way2Wealth Brokers Pvt. Ltd

LIC Housing Finance: Buy at CMP 559| Target Rs627| Stop loss Rs535| Timeframe 15 to 21 sessions| Return 12%

Looking at the daily chart, the stock has formed a strong base near 540 – 535 zone and due to recent consolidation stock formed inverse head & shoulder pattern on daily chart.

The daily RSI (14) has signaled a probable range shift. Hence, we recommend traders to buy this stock at current level off Rs565 with a price target of Rs627. A Stop loss should be placed at Rs535 on a daily closing basis.

Motherson Sumi Systems Ltd: Sell around Rs370 – 375| Target Rs340| Stop loss Rs389| Time frame 15 to 21 trading sessions| Return 8%

Looking at the daily chart, the stock has been in a long-protracted uptrend since past several months and in that optimism, the stock hit a fresh all-time high of around Rs396.

Subsequently, stock saw mild profit booking which was followed by consolidation. As a result, the stock is forming a triangle pattern. The daily RSI (14) is struggling to cross 60 levels which doesn’t bode well for bulls.

Also, we are observing three-point bearish divergences on the weekly chart. Hence, we advocate traders to go short in this stock around Rs370-375 with a price target of Rs340 and a stop loss placed above Rs389.

Suven Life Sciences: Buy above Rs223| Target Rs268| Stop loss Rs196| Time frame 15 to 21 trading session| Return 24%

Looking at the weekly chart, the stock has confirmed its breakout from downward sloping trend line during mid-October 2017 which triggered a fresh buying interest.

In that optimism, the stock rallied towards 230. Subsequently, stock witnessed profit booking which led to gradual correction followed by consolidation.

Now, the daily chart has formed a Bullish Cup & handle pattern and the formation of handle formation is in process. The said pattern will be confirmed once stock breaches the Rs223 levels.

In that case, we expect an acceleration of bullish momentum and stock likely to rally towards Rs268. A stop loss should be placed below Rs196.

Analyst: Rajesh Palviya, Head – Technical & Derivatives Analyst, Axis Securities

Adani Ports: CMP Rs436| Target Rs460-470| Stop Loss Rs418| Time 8-15 days| Return 7.8%

The stock has witnessed the breakout of symmetrical triangle pattern breakout on weekly chart at427 level. The stock was consolidating in range of 380-425 range since last three months.

The breakout of the Triangle pattern suggests stock can move towards 460-470 level in the short term. The stock is sustaining above all its important moving averages which support bullish sentiment ahead.

The weekly and the daily strength indicators are in positive territory which indicates the bullish trend to continue in short term.

Vedanta Ltd: CMP Rs345.4| Target Rs370-376| Stop Loss Rs325| Time 8-15 days| Return 9%

The most prominent observation on the price chart of Vedanta is that the entire consolidation underway since November 2017 till date has formed a Cup and Handle formation.

The breakout of this formation is witnessed at 345 levels on the daily chart. The stock is sustaining above its 20, 50, 100 & 200 day SMA which supports bullish sentiments ahead.

On the volumes front, the stock has witnessed a significant rise in breakout level indicating increased participation on the rally.

Both weekly & monthly strength indicator RSI is in bullish territory and sustaining above their reference lines which signals strength and upward momentum in price. Thus, taking into consideration the above factors, the maximum upside can be expected to 370-376.

Disclaimer: The views and investment tips are expressed by the investment experts on moneycontrol.com are their own and not that of the website or its management. Moneycontrol.com advises users to check with certified experts before taking any investment decisions.

Trade setup for Tuesday: Top 15 things you should know before Opening Bell

Posted on

Investors are advised to stay light as we approach the crucial Budget Day and avoid taking leverage in trading. There are no signs which suggest that the momentum is weakening; hence, investors should remain long with a stop below 11000.

The Nifty rallied from the word go and rose to a fresh record high of 11,171.55 on Monday, but pared some gains towards the close of the session. It formed a small bull candle on the daily candlestick charts which suggest that there was profit booking at higher levels.

Investors are advised to stay light as we approach the crucial Budget Day and avoid taking leverage in trading. There are no signs which suggest that the momentum is weakening; hence, investors should remain long with a stop below 11000.

The Nifty formed a small bullish candle after a Hanging Man kind of pattern which negated any bearish outlook formed in the previous trading session.

The Nifty opened at 11,079 slipped marginally to hit its intraday low of 11,075.95. It rose to a record high of 11,171.55 before closing 60 points higher to close at 11,130.40.

“The Nifty witnessed a small bullish candle but with a slightly longer upper shadow suggesting that market participants preferred to lock in their profits at higher levels as a major economic event in the form of budget is around the corner,” Mazhar Mohammad, Chief Strategist – Technical Research & Trading Advisory, Chartviewindia.in told Moneycontrol.

“More intraday weakness in the next trading session can be expected if the indices trade below 11075 levels for at least one hour whereas selling pressure should get enhanced if indices close below 11000 levels,” he said.

Mohammad further added that it now appears that for expansion of the rally on the upside, Nifty need one more breakout above 11160 on lower time frame charts which should then take it towards 11400 levels. “Traders need to place a tight stop below 11000 on a closing basis and prefer to lock in their profits if the stop gets triggered,” he said.

India VIX moved up by 2.18% at 17.89. Rising volatility suggests volatile swing could continue in the market while the rising Put Call ratio is supporting the overall Bullish trend of the market.

We have collated the top fifteen data points to help you spot profitable trade:

Key Support & Resistance Level for Nifty:

The Nifty closed at 11,130.4 on Monday. According to Pivot charts, the key support level is placed at 11,080.43, followed by 11,030.47. If the index starts to move higher, key resistance levels to watch out are 11,175.93 and 11,221.47.

Nifty Bank:

The Nifty Bank closed at 27,498.4. Important Pivot level, which will act as crucial support for the index, is placed at 27,386.5, followed by 27,274.6. On the upside, key resistance levels are placed at 27,631.2, followed by 27,764.0.

Call Options Data:

Maximum call open interest (OI) of 25.33 lakh contracts stands at strike price 11,000, which will be a crucial base for the January series, followed by 11,500, which now holds 24.69 lakh contracts in open interest, and 11,200, which has accumulated 20.99 lakh contracts in OI.

Call writing was seen at the strike price of 11,000, which saw the addition of 3.61 lakh contracts along with 11,400, which added 3.16 lakh contracts, along with 11,600, which saw the addition of 2.99 lakh contracts.

Call unwinding was seen at strike price of 10,800, which shed 6.13 lakh contracts, followed by 10,900, which shed 1.1 lakh contracts.

Image1

Put Options Data:

Maximum put OI of 34 lakh contracts was seen at strike price 11,000, which will act as a crucial base for January series, followed by 10,800, which now holds 33.67 lakh contracts and 10,700 which has now accumulated 27.37 lakh contracts in open interest.

Maximum Put writing was seen at the strike price of 11,000, which saw the addition of 10.98 lakh contracts, followed by 10,800, which added 7.82 lakh contracts and 10,900, which added 5.82 lakh contracts.

There was hardly any Put unwinding seen.

Image2

FII & DII Data:

Foreign institutional investors (FIIs) bought shares worth Rs 937.31 crore, while domestic institutional investors (DIIs) sold shares worth Rs 965.67 crore in the Indian equity market, as per provisional data available on the NSE.

Fund Flow Picture:

fund flow

Stocks with high delivery percentage:

High delivery percentage suggests that investors are accepting the delivery of the stock, which means that investors are bullish on the stock.

Image4

49 stocks saw long build-up:

Image5

26 stocks saw short covering:

A decrease in open interest along with an increase in price mostly indicates short covering.

Image6

118 stocks saw short build-up:

An increase in open interest along with a decrease in price mostly indicates short positions being built up.

Image7

17 stocks saw long unwinding:

Long unwinding happens when there is a decrease in OI as well as in price.

Image8

Bulk Deals:

Bhushan Steel Limited: Earc Trust SC 283 sold 33,12,018 shares at Rs 59.74 per share.

Hindustan Oil Exploration: Poddar Pigments Limited sold 9,87,000 shares at Rs 137 per share

Newgen Software Tech Ltd: Malabar India Fund Limited bought 8,25,038 shares at Rs 252.98 per share

(For more bulk deals click here: https://goo.gl/qrXHCH)

Analyst or Board Meet/Briefings:

The Board of Advanced Enzymes will be meeting on February 6, 2018 to discuss financial results.

Andhra Bank’s board will be meeting on February 8, 2018 to discuss financial results.

Ashok Leyland has called for a conference call on February 2, 2018.

Aegis Logistics will be having a conference call on February 2, 2018 to discuss the financial results.

Stocks in news:

Abbott India: Ranjan Kumar, Independent Director, passed away on January 27, 2018.

Unitech: The company has finalised a deal to sell land worth Rs 400 crore

Tata Power: Anil Sardana Resigns As CEO & MD Of Co For ‘Personal Reasons’

Ester Industries: Enters into long term agreement with Shaw Industries Group Inc, USA

Indian Metals & Ferro Alloys: Q3 net profit rises 16.9% At Rs 74.7 Cr Vs Rs 63.9 Cr (YoY)

Wockhardt: The company posted a Q3 loss of Rs 42.6 Cr Vs Rs 60.4 Cr (YoY)

Emami posts 10% rise in Q3 net profit at Rs 147.2 cr; op margin contracts

Tech Mahindra Q3 beats estimates, profit up 13% at Rs 943 cr; EBITDA margin expands 180 bps

1 stock under ban period on NSE

Security in ban period for the next trade date under the F&O segment includes companies in which the security has crossed 95 percent of the market-wide position limit.

The security which is banned for trading is JP Associates.​

Economic Survey 2018 explains boom in stock markets, Subramanian asks to be watchful

Posted on

Since end-December 2015, the S&P index has surged 45 percent, while the Sensex has surged 46 percent in rupee terms and 52 percent in dollar terms.

Moneycontrol News@moneycontrolcom

Over the past two fiscal years, the Indian stock market has soared, outperforming many other major markets. Since end-December 2015, the S&P index has surged 45 percent, while the Sensex has surged 46 percent in rupee terms and 52 percent in dollar terms.

This has led to a convergence in the price-earnings ratios of the Indian stock market to that of the US at a lofty level of about 26x. Yet over this period the Indian and US economies have been following different paths, highlights Economic Survey.

CEA Arvind Subramanian, however, speaking after presenting the Economic Survey said, “We have seen around the world that when asset prices go up very much, they always tend to come back and so we have to be watchful. The higher the prices go, I think our vigilance should increase correspondingly.”

Also read – Economic Survey 2018: Higher growth rate, possible revival in private capex among top 10 takeaways

Though Subramanian’s advice for caution is well founded, a deeper dive to explaining the sudden convergence in stock markets, may offer a better understanding of the market’s prevalent behaviour.

The paths of the Indian and US economies have differed in three striking ways:

a) The stock market surge in India has coincided with a deceleration in economic growth, whereas US growth has accelerated.

b) India’s current corporate earnings/GDP ratio has been sliding since the Global Financial Crisis, falling to just 3 ½ percent, while profits in the US have remained a healthy 9 percent of GDP. Moreover, the recently legislated tax cuts in the US are likely to increase post-tax earnings.

Also read – Economic Survey 2018: Amount raised from primary markets could double from levels seen in last 6 years

c) Critically, real interest rates have diverged substantially. Rates in the US have persisted at negative levels, while those in India have risen to historically high levels. Over the period of the boom, US real rates have averaged -1.0 percent, compared to India’s 2.2 percent, a difference of 3.2 percentage points.

10

Economic Survey explains the stock market convergence?

Two factors seem to be at work. First, expectations of earnings growth are much higher in India. Indeed, it was such expectations that lie at the origin of the stock market boom.

In early 2016-17, signs emerged that the long slide in the corporate profits/GDP ratio might finally be coming to an end. Investors reacted to this news with alacrity, bidding up share prices in anticipation of a recovery they hoped lay just ahead.

Accordingly, the ratio of prices to current earnings rose sharply. By 2017-18 signs began to accumulate that the profit recovery was not obviously around the corner. But, at that point, a second factor gave the market further impetus. That factor was demonetisation.

The price of an asset is not solely determined by the expected return on that asset. It is also determined by the returns available on other assets.

As pointed out in last year’s Economic Survey, the government’s campaign against illicit wealth over the past few years—exemplified by demonetisation—has in effect imposed a tax on certain activities, specifically the holding of cash, property, or gold.

Also Read – Budget 2018Avoid buying mid & smallcap stocks ahead of Budget; largecaps a preferred play

Cash transactions have been regulated; reporting requirements for the acquisition of gold and property have been stiffened. In addition, rupee returns to holding gold have plunged since mid-2016, turning negative since mid-2017.

In addition, previously, stock prices had suffered because reporting requirements were higher on shares than purchases of another asset. But the attack on illicit wealth has helped to level the playing field, said the Survey.

All of this has caused investors to re-evaluate the attractiveness of stocks. Investors have accordingly reallocated their portfolios toward shares, with inflows through stock mutual funds, in particular, amounting in 2016-17 to five times their previous year’s level.

11

Accordingly, the equity risk premium (ERP, the extra return required on shares compared with other assets) has fallen. Does this imply that Indian P/E ratios have reached a higher “new normal”? Perhaps.

It’s possible that the portfolio shift set in train by the campaign against illicit wealth will result in a sustained reduction in the ERP. But it is worth recalling that a similar assessment was made in the US after its ERP fell sharply in the late 1990s-early 2000s.

A few years later, the technology bubble collapsed, then the Global Financial Crisis occurred. The ERP surged to new heights and still hasn’t reverted to its previous trough.

Beyond ERPs, sustaining current stock valuations in India also requires future earnings performance to rise to meet still high expectations. And this outlook, in turn, depends on whether a significant economic rebound is this time well and truly around the corner.

12

Stocks in the news: HDFC, Tech Mahindra, Maruti Suzuki, RIL, Vakrangee, Idea, Pfizer, Vedanta

Posted on

HDFC | Tech Mahindra | Maruti Suzuki | Vakrangee | Deepak Nitrite | Kokuyu Camlin | Idea Cellular | Bharat Forge | Pfizer | Hindustan Copper | Havells | Vedanta | Andhra Bank | Reliance Industries and DLS are stocks, which are in news today.

Here are stocks that are in news today:Results Today:

Emami , HDFC, Tech Mahindra, Apar Industries Limited, Astra Microwave Products, Astron Paper & Board Mill, Automobile Corporation Of Goa, Balaji Amines Limited, Balaji Amines, Balmer Lawrie, Binani Industries, Century Textiles, De Nora, Elgi Equipments, , Emkay Global Financial Services, Himadri Speciality Chemical Limited, HSIL LTD. INOX Leisure Limited, INEOS Styrolution India, IDFC, Indian Metals & Ferro Alloys, Laurus Labs, Maharashtra Scooters, Mahindra Logistics, Novartis India, Orient Cement, Ramkrishna Forgings, Reliance Communications, SIS, Shakti Pumps, Siyaram Silk Mills, SPARC, Subex, Sundaram Finance Limited, Trident Limited, Wockhardt

Maruti Suzuki Q3
Net Profit (GU) 3% at Rs 1,799 cr vs Rs 1,747 cr (YoY)
EBITDA (GU) 22.1% at Rs 3,038 cr vs Rs 2,488 cr (YoY)
EBITDA Margin at 15.7% vs 14.7% (YoY)
Revenue (GU) 14.2% at Rs 19,283 cr vs Rs 16,888 cr (YoY)

 Avenue Supermarts Q3

Net Profit (GU) 65.8% at Rs 251.8 cr vs Rs 151.9 Cr (YoY)
Revenue (GU) 22.6% at Rs 4,094.8 cr vs Rs 3,339.3 cr (YoY)
EBITDA (GU) 46.4% at Rs 421.8 cr vs Rs 288.2 cr (YoY)
EBITDA Margin at 10.3% Vs 8.63% (YoY)

LIC Hsg Fin Q3
Net Profit at Rs 491 cr Vs CNBC-TV18 poll of Rs 514 Cr
NII at Rs 923 Cr Vs CNBC-TV18 Poll of Rs 937.1 Cr
Net Profit (RD) 1.7% at Rs 491 cr Vs Rs 499.3 cr (YoY)
NII (RD) 0.8% at Rs 923 cr Vs Rs 930.8 cr (YoY)

JSPL Q3
Revenue (GU) 29.3% at Rs 6,992.6 cr Vs Rs 5,408 cr (YoY)
Net Loss at Rs 272.7 cr Vs loss of Rs 453.3 cr (YoY)
EBITDA (GU) 25.8% at Rs 1,606.5 cr vs Rs 1,276.8 cr
EBITDA Margin at 22.9% vs 23.3% (YoY)

Other stocks and sectors in the news
Future supply chain solutions buys Vulcan Express from Snapdeal
Vakrangee announces alliance with Cinestaan Digital
Deepak Nitrite fixes issue price of QIP at Rs 264
Kokuyu Camlin to wind up Camlin International
Idea Cellular seeks government nod for raising FDI limit to 100 percent
Bharat Forge sets up unit in Israel
Havells to set up a new facility to manufacture consumer durables in Rajasthan for a total investment of Rs 360 crore
Hindustan Copper to consider raising funds via QIP
Pfizer gets US FDA nod for chest pain drug, Nitroglycerin tablet
Ebix, London based Investor vie for Debt ridden Educomp
Vedanta awarded two bauxite mines in Odisha
Tata Power’s CEO Sardana may quit as group looks to rejig businesses
JSW may double its bid offer for Bhushan Steel to Rs 30,000 cr
Vakrangee – Aadhaar enrolment firm under SEBIs scanner
Andhra Bank to sell SEL manufacturing loan to ARCs
Reliance Industries Jio to raise up to USD 2.2bn to fund Rcom dealDLF may launch QIP by April, raise Rs 50bn

SOURCE: http://www.moneycontrol.com/news/business/stocks/stocks-in-the-news-hdfc-tech-mahindra-maruti-suzuki-ril-vakrangee-idea-pfizer-vedanta-2493035.html

STOCKS HOLD FOR THE NEXT 5 YEARS

Posted on

STOCKS TO BUY AND HOLD FOR THE NEXT 5 YEARS

Best advice to investors has always been to buy stocks for the long term. Invest your Money at best place. 

  • Ashok Leyland
  • HUL 
  • INFOSYS
  • lupin
  • BEL
  • Biocon
  • Titan
  • Sun Pharma
  • Relience Industries
  • TORRENT PHARMA
  • Britannia Industries
  • DABUR 
  • GAIL INDIA
  • TCS
  • Tata Elxsi, 
  • TATA CONSUMER PRODUCTS
  • Tata Steel
  • Lloyd Electric & Engineering Ltd
  • Suzlon Energy Ltd
  • Cipla
  • MIC Electronics Ltd
  • Trident Ltd
  • Symphony
  • Motherson Sumi
  • Ajanta Pharma


————————————————————————————————————————————-

DISCLAIMER

The recommendations made herein do not constitute an offer to sell or a solicitation to buy any of herein will be profitable or that they will not result in losses. Readers using the information contained herein are solely responsible for their actions. Information is obtained from sources deemed to be reliable but is not guaranteed as to accuracy and completeness. The above recommendations are based on the theory of Technical Analysis by different TV channels and websites and do not reflect the fundamental validity of the Scrip.

Visitors to the site and clients do accept & understand that Trading in the equity markets both in the cash and derivatives format is a risky business. They may lose some or all of their capital. They understand that advisory services require proper money management and psychology. They are taking the services of this blog as an educational mechanism and they shall solely be responsible for all trading and investment decisions taken by them.

DISCLOSURE IN RESEARCH REPORTS

  • I declare that I do not have any financial interest of any kind in any of the company that I report on or recommend.
  • I declare that I do not hold any holding in securities of companies that I report on or recommend.
  • I declare that there is no conflict of interest whatsoever of any kind.
  • I declare that I have no interest whatsoever of any kind in market making in the securities of companies referred to in my report or recommendations.
  • I declare that I am not a director or have any relationship of any kind in the company’s referred in my report or recommendations.
  • I declare that I did not have any past relations with the companies of any kind that report or recommend.


cool gadgets of the future

Posted on

The shape of the future (of television)

An attendee walks through LG's television display at CES 2018


One of the wildest announcements comes from LG, who showed off a protoype for its rollable display televisions. Why yes, you could lowkey roll up your flat screen like you would a yoga mat. According to CNN, LG showcased a TV that “wraps around a metal cylinder, kind of like a window blind” at the press of a button (or, in one display, it will be able to disappear when not in use), allowing you to store it in a long box. The TVs are said to look like regular TVs, and on display was an 18″ 4K OLED display TV with the tech. It sounds like this tech might be a while before seeing it in our homes at this time; LG is reportedly selling off the tech directly to manufacturers, who will then use it however they see fit in their own electronics. It would make moving that 42″ TV much easier in the future, though.

Smartwatches as medical devices

The Apple Watch might be the most boring thing that Apple has ever made, but the grand plan for it, and smartwatches, in general, isn’t boring at all. More than anything, these glorified messaging machines might save our lives one day.

2017 was the year that the Apple Watch got good, and it was also the year that the FDA approved the first medical device accessory. The Kardiaband is an add-on that can detect an abnormal heart rate. What’s more, a UCSF study found that Apple’s built-in heart monitor could detect an abnormal heart rate with 97 percent accuracy when an AI-based algorithm called DeepHeart was used in conjunction with the device. The same team behind that study later found that the Apple Watch-DeepHeart combo could detect sleep apnea with 90 percent accuracy, and hypertension with 82 percent accuracy. Both of those conditions are quite a chore to detect with the current methods.

It’s still early in the quest to make a smartwatch a magical medical wizard that brings a silver bullet to preventative medicine, but we’re getting there.

Don’t get too excited: Privacy issues abound, and we’re going to have to work them out before this technology matures, not after.


Allergy detection gadgets

2018 ces

Allergy Amulet is a portable device that can detect food allergens or certain ingredients. It also doubles as a cute piece of jewelery when hung on a necklace.

To use the device, you’ll need to insert a disposable test trip into any suspicious food and pop it in the reader. After a few seconds, the reader will turn red or green to tell you if the food contains the target allergen or ingredient. It can test for milk, soy, dairy, shellfish, finned fish, wheat, eggs and nuts.

Each strip costs $1 to $3 and the reader will cost between $100 to $250. Pre-sales begin this fall and the device will be available in 2019.

Another startup called Nima also showed off pocket-sized devices that test a food sample for the presence of peanut proteins or gluten.Nima’s sensors take about three minutes to test the sample, but the results can be quicker if there is more of an allergen present.

The Nima Gluten Sensor is available now for $289, while the Nima Peanut Sensor is available for pre-order at a discount of $229.

Rollable TV

LG Display rollable

LG Display — the research arm of LG Electronics — unveiled a prototype of its latest rolling screen technology.

The 4K OLED display resembles a normal TV screen, but the back has small vertical slats which let it roll up around a metal base. You can lower the screen into a box by pressing a button.

But such displays won’t be in electronics stores anytime soon. The company sells the tech directly to display manufacturers, which may or may not use it for their own devices.


Prosthetics that learn how you move

2018 ces

BrainRobotics wants to build a new kind of prosthetic limb.

The device uses a band of eight electrodes to detect the electrical signals caused by contracting muscles — called electromyography — when the wearer moves. It collects that information and uses it in an algorithm that learns your habits over time.

When the wearer’s muscles replicate the signal, the prosthetic will move accordingly.

But the real innovation of the device could be its price. It will cost $2,000 to $4,000, less than similar designs. And it will have a modular design that allows the wearer to replace any individual broken pieces instead of having to repair the entire limb.

The year-old company was started in Boston by MIT and Harvard graduates, and was originally part of the Harvard Innovation Lab. The prosthetic is still in the testing phases with with early users like Mincheng Ni (pictured). BrainRobotics hopes to have it in mass production by the end of 2018.

Food gadgets

2018 ces

How long has that block of cheese been in your fridge? You could eat it and find out, or you could try some of these trackers that work with Alexa.

Chicago-based startup Ovie Smarterware is developing food tracking tech. After you tell Amazon’s voice assistant technology what you’re putting in your fridge, it’ll track how many days it can stay fresh.

But you’ll need to strap a little tracker to the food item, and it will turn colors when the cheddar is no longer ideal for eating. Cost: $59 for a set of three.

Self-driving travel bag

China’s ForwardX Robotics demonstrated a four-wheeled travel bag that automatically follows its user around the airport. The smart bag uses cameras and AI to avoid crashes. The device can message the owner if it gets too far away or when the battery power gets low.

Attendees take pictures of ForwardX Robotics' CX-1 self-driving luggage during CES Unveiled at CES International Sunday, Jan. 7, 2018, in Las Vegas. (AP Photo/Jae C. Hong)