
By Aditya Agarwala
The Nifty50 Index continued to ascend following an extended weekend adding a total of 5 percent in the month of January so far. Further, the ongoing impulse wave 3 can extend up to 11,390 being 161.8% extension of the wave 1 (i.e. 6833-8995).
The immediate resistance on the upside is placed in the range of 11,200-11,250, and a sustained trade above 11,250 can take it to levels of 11,390.
Moreover, the relative strength index (RSI) has started forming a negative divergence on the daily chart suggesting that the uptrend is maturing gradually.

Failure to cross 11,250 can lead to minor profit booking dragging the Index lower to levels of 10,810-10,725 being 50% & 61.8% Fibonacci retracement levels respectively.
The Bank Nifty is also approaching upper end of a rising channel placed at 27900, following a massive gain of 7 percent in the month so far.
Failure to cross this resistance can lead to profit booking dragging it lower to levels of 26,840-26,595. However, a sustained trade above 27,900 can extend the up move to levels of 28,990.
Here is a list of three stocks which can give up to 26% return in the next 3-4 weeks:
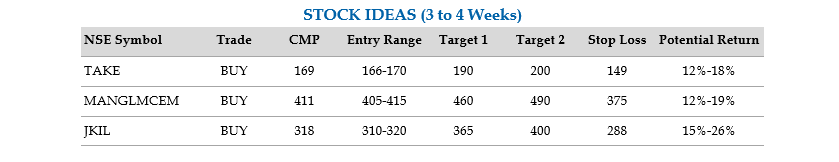
Take Solutions Ltd: BUY| Target Rs200| Stop Loss Rs149| Return 18%
On the weekly chart, Take Solutions Ltd. (TAKE) is on the verge of a breakout from an Ascending Triangle pattern suggesting the start of a bull trend on the cards. A sustained trade above Rs 180 i.e. neckline of the pattern with healthy volumes may trigger a bullish breakout.
On the daily chart, the stock is consolidating sideways after taking support at 61.8% Fibonacci retracement level. A sustained trade above Rs 178 will trigger a bullish breakout.
RSI has formed a positive divergence with respect to price after taking support at the 40 level. The stock may be bought in the range of Rs 166-170 for the target of Rs 190-200, and keeping a stop loss below Rs 149.
Mangalam Cement Ltd: BUY| Target Rs490| Stop Loss Rs375| Return 19%
On the weekly chart, Mangalam Cement Ltd. is in a throwback mode following its breakout from a Triangle pattern. Neckline support of the pattern is at Rs 390; sustained trade above the neckline with healthy volumes can resume the uptrend.
On the daily chart, the stock is approaching 61.8% Fibonacci retracement support level placed at Rs 396. A sustained trade above this support can take the stock higher.
RSI has turned upwards breaking out of the upper band of the Bollinger Bands suggesting higher levels in the coming trading sessions. The stock may be bought in the range of Rs 405-415 for targets of Rs 460-490, keeping a stop loss below Rs 375.
J. Kumar Infraprojects Ltd: BUY| Target Rs400| Stop Loss Rs288| Return 26%
On the weekly chart, J. Kumar Infraprojects Ltd is in a throwback mode to test the trend line support placed at Rs 280 levels. A sustained trade above Rs 280 can resume the uptrend taking the stock higher.
On the daily chart, it has taken support at the lower end of the channel and turned upwards affirming the bullishness.
Further, RSI has also broken down from the lower Bollinger band suggesting lower levels. The stock may be sold in the range of Rs 310-320 for targets of Rs 365-400, keeping a stop loss below Rs 288.
Disclaimer: The author is Technical Analyst, YES Securities (I) Ltd. The views and investment tips expressed by investment expert on Moneycontrol.com are his own and not that of the website or its management. Moneycontrol.com advises users to check with certified experts before taking any investment decisions.
April 3, 2025 at 7:31 am
Your point of view caught my eye and was very interesting. Thanks. I have a question for you.
May 12, 2025 at 2:19 pm
Your article helped me a lot, is there any more related content? Thanks!
August 31, 2025 at 6:54 am
Can you be more specific about the content of your article? After reading it, I still have some doubts. Hope you can help me.