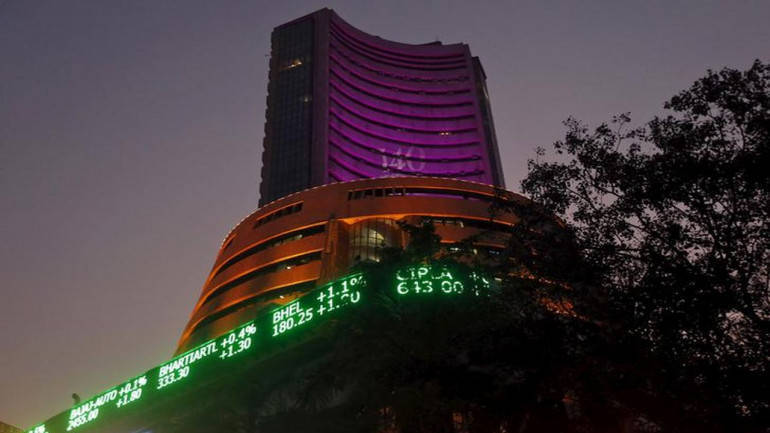
Trade setup for Friday: Top 15 things you should know before Opening Bell
A High Wave kind of pattern is formed when there is a long upper shadow and a long lower shadow with a small body. The pattern is similar to a spinning top kind of pattern but in the high wave, the shadows are longer.
The D-Street witnessed a volatile day as the index moved in a band of over 200-points on throughout the trading session on Thursday which led to a formation of a ‘High Wave’ kind of pattern on the daily candlestick charts.
The index started with gains of nearly 100 points but bears soon took control of D-Street after the finance minister proposed a revised fiscal deficit of 3.5 percent from the proposed 3.2 percent earlier.
The government reverted to fiscal consolidation roadmap with a target of 3.3 percent for 2018-2019 which was still higher than the analyst estimate of 3.2 percent.
A High Wave kind of pattern is formed when there is a long upper shadow and a long lower shadow with a small body. The pattern is similar to a spinning top kind of pattern but in the high wave, the shadows are longer.

The Nifty which opened at 11,044 which rose to an intraday high of 11,117.35. But, bears took control of D-Street and pushed the index below 13-DEMA to touch its intraday low of 10,878. The index closed near its 5-DEMA at 11,016, down 10 points.
“The Nifty registered a High Wave kind of formation as it witnessed a wild swing of around 240 points on an intraday basis before signing off the day with a marginal cut,” Mazhar Mohammad, Chief Strategist – Technical Research & Trading Advisory, Chartviewindia.in told Moneycontrol.
“Despite this kind of wild gyrations bulls managed to defend critical support points on short-term charts as a result of which uptrend is still intact. However, for expansion of the rally on the upside and momentum to pick up bulls need to initially push the indices beyond 11171 levels on closing basis,” he said.
Mohammad further added that in such a scenario targets close to 11500 can be expected. Meanwhile, if bears manage to push the indices below 10900 levels on closing basis then trend should turn in their favour. Traders are advised to maintain a stop below 10900 levels on closing basis.
India VIX fell down by 11.44 percent at 14.10. The volatility remained lower for the third consecutive session and it may further decline to 13-12.50 zones as a hangover of the event has gone and the market will take its own ride.
We have collated the top fifteen data points to help you spot profitable trade:
Key Support & Resistance Level for Nifty:
The Nifty closed at 11,016.9 on Thursday. According to Pivot charts, the key support level is placed at 10,891.37, followed by 10,765.83. If the index starts to move higher, key resistance levels to watch out are 11,129.87 and 11,242.83.
Nifty Bank:
The Nifty Bank closed at 27,220.7. Important Pivot level, which will act as crucial support for the index, is placed at 26,973.5, followed by 26,726.3. On the upside, key resistance levels are placed at 27,540.7, followed by 27,860.7.
Call Options Data:
Maximum call open interest (OI) of 61.24 lakh contracts stands at strike price 11,500, which will be a crucial base for the January series, followed by 11,400, which now holds 35.31 lakh contracts in open interest, and 11,200, which has accumulated 31.23 lakh contracts in OI.
Call writing was seen at the strike price of 11,500, which saw the addition of 20.16 lakh contracts along with 11,400, which added 6.97 lakh contracts, along with 11,200, which saw the addition of 5.73 lakh contracts.
There was hardly any Call unwinding seen.

Put Options Data:
Maximum put OI of 59.24 lakh contracts was seen at strike price 10,500, which will act as a crucial base for January series, followed by 11,000, which now holds 44.08 lakh contracts and 10,700 which has now accumulated 40.20 lakh contracts in open interest.
Maximum Put writing was seen at the strike price of 10,800, which saw the addition of 6.71 lakh contracts, followed by 10,900, which added 6.36 lakh contracts and 11,000, which added 3.95 lakh contracts.
There was hardly any put unwinding seen.

FII & DII Data:
Foreign institutional investors (FIIs) bought shares worth Rs 1,099.78 crore, while domestic institutional investors (DIIs) sold shares worth Rs 358.5 crore in the Indian equity market, as per provisional data available on the NSE.
Fund Flow Picture:

Stocks with high delivery percentage:
High delivery percentage suggests that investors are accepting the delivery of the stock, which means that investors are bullish on the stock.

41 stocks saw long build-up:

46 stocks saw short covering:
A decrease in open interest along with an increase in price mostly indicates short covering.

68 stocks saw short build-up:
An increase in open interest along with a decrease in price mostly indicates short positions being built up.

55 stocks saw long unwinding:
Long unwinding happens when there is a decrease in OI as well as in price.

Bulk Deals:
Fortis Healthcare: Societe Generale has sold 34.56 lakh shares of the firm at Rs 130.26.
Jain Irrigation: Societe Generale bought 30.96 lakh shares of the firm at Rs 135.01.
(For more bulk deals click here: https://goo.gl/qrXHCH)
Analyst or Board Meet/Briefings:
Alkem Labs has called for a conference call to discuss its financial results on February 9, 2018.
Stocks in news:
Titan Company Q3 misses estimates, profit rises 21%; jewellery revenue up 8%
Ashok Leyland records 21.7% sales rise in January
Mahindra January volume up 32%; tractor sales jump 18%
4 stocks under ban period on NSE
Security in ban period for the next trade date under the F&O segment include companies in which the security has crossed 95 percent of the market-wide position limit.
The security which are banned for trading are Fortis, Jain Irrigation, JP Associates and Wockhardt.
June 1, 2025 at 7:20 pm
Thanks for sharing. I read many of your blog posts, cool, your blog is very good.